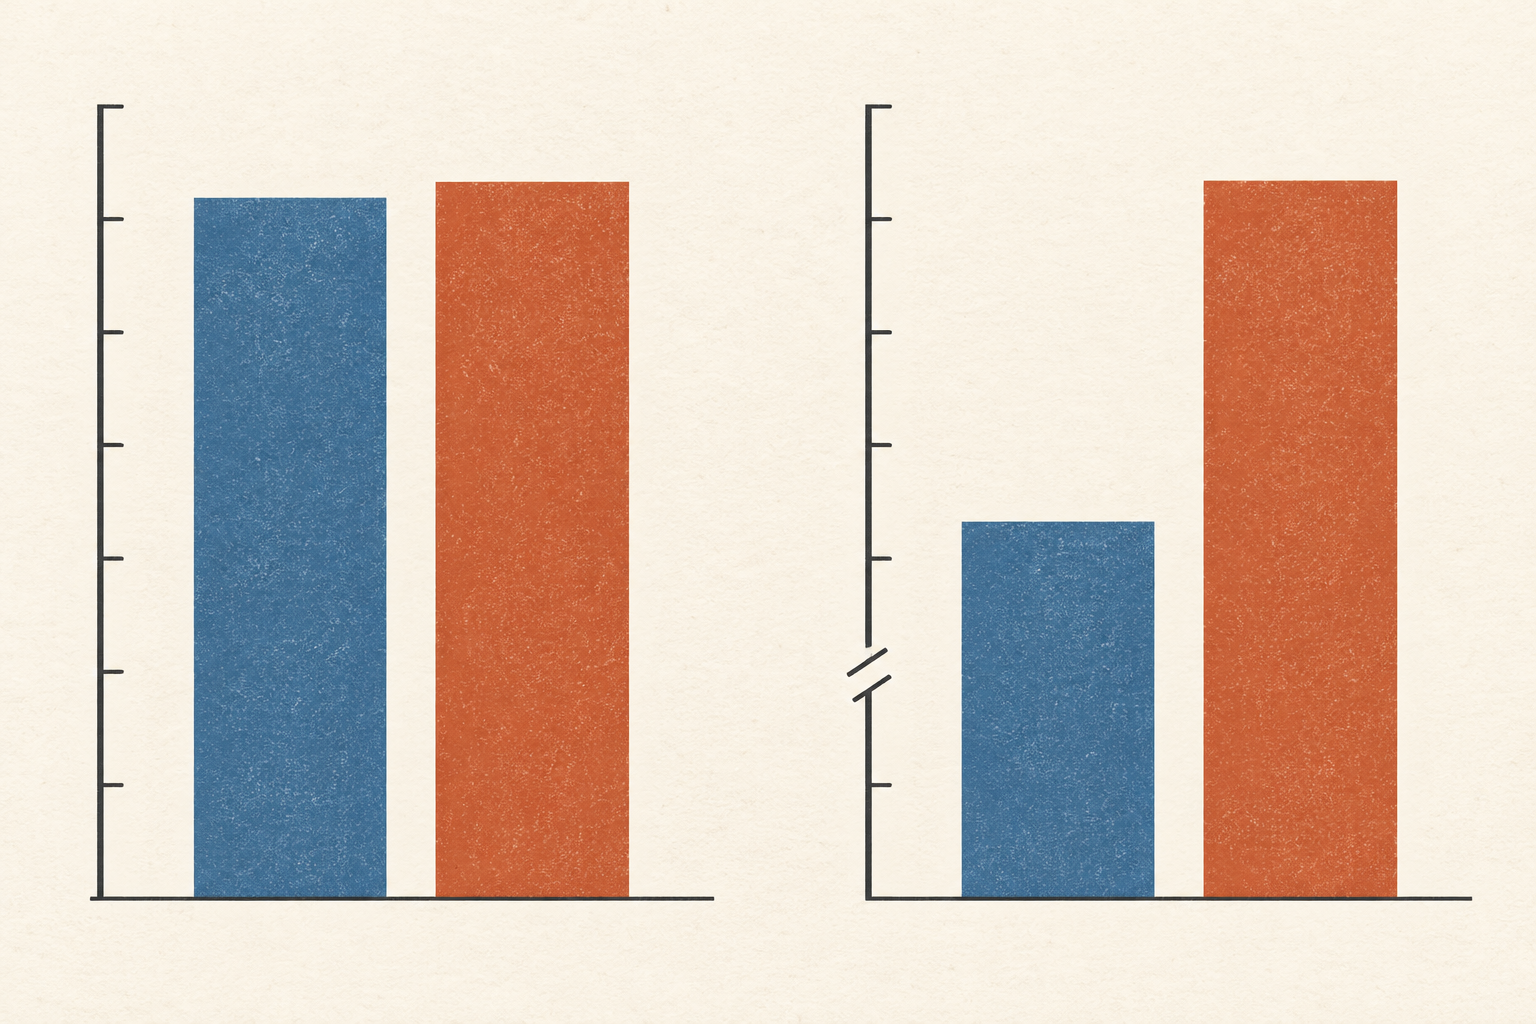
Reading a chart with an uneven baseline
A cropped axis can turn a small gap between values into a towering gap between bars. The right way to read it depends on the mark, the scale, and the comparison being asked of the reader.
Follow a thread
2 stories found Clear filters ↗
A cropped axis can turn a small gap between values into a towering gap between bars. The right way to read it depends on the mark, the scale, and the comparison being asked of the reader.
A percentage can be accurate and still leave its central question unanswered. Trial results, road fatalities and graduate admissions show how the population, exposure and time beneath a number change what it means.