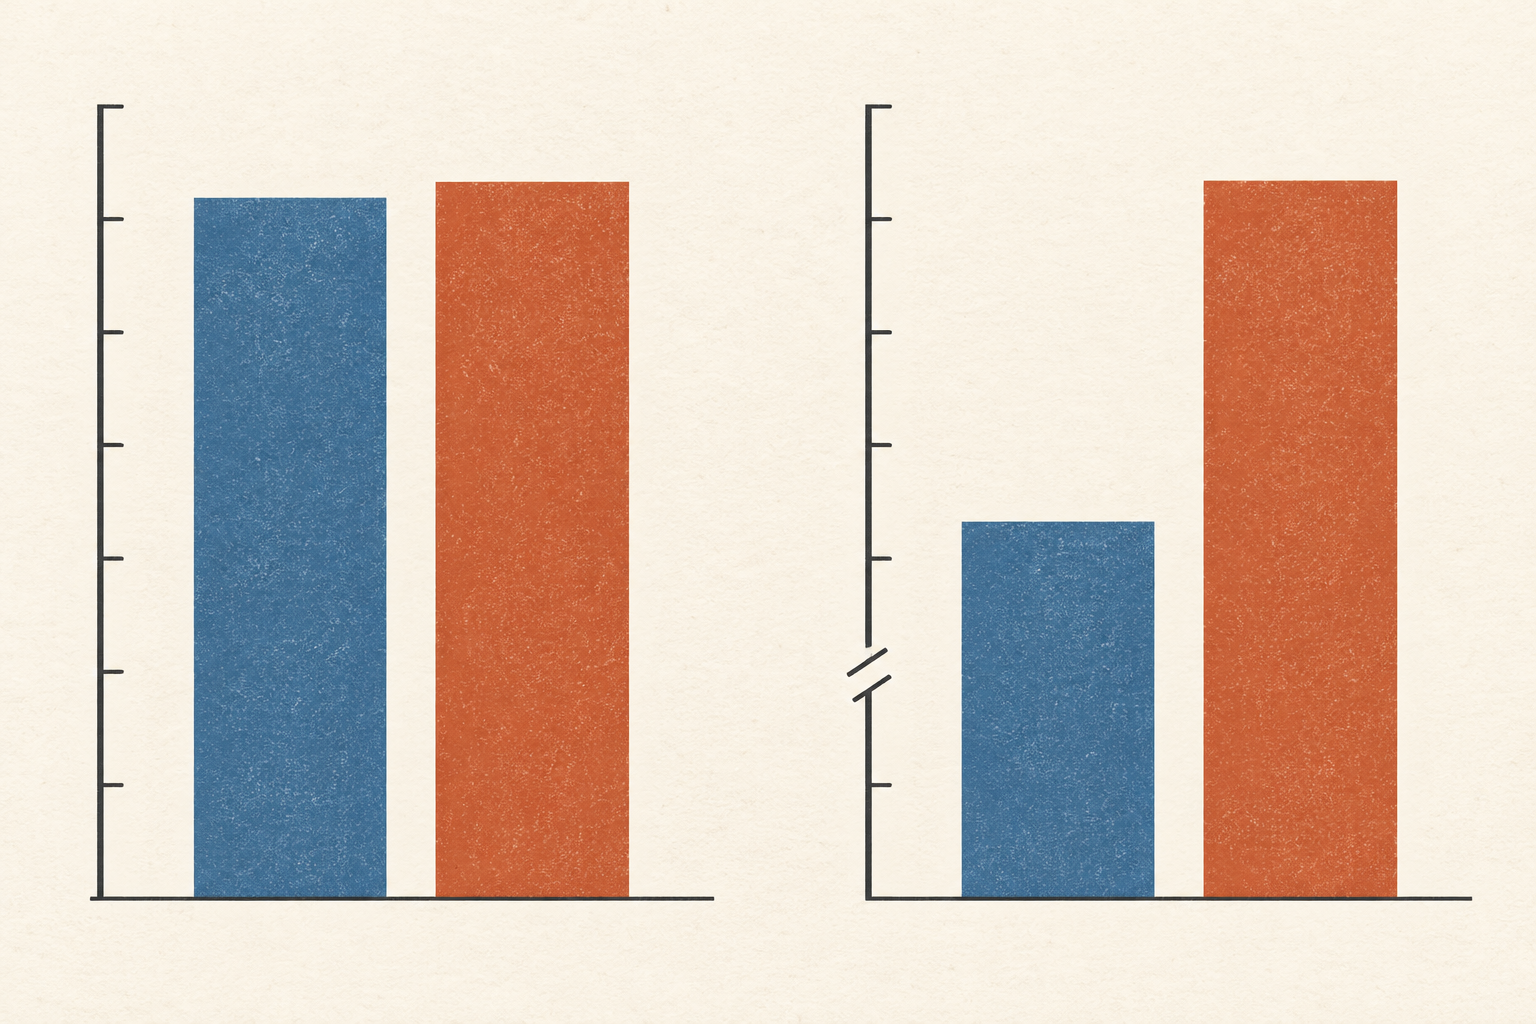
Two bars stand side by side. One reaches a little higher, yet the difference looks enormous. The numbers printed above them are 98 and 100. Look down the vertical axis: it begins at 95. The first bar has three units of visible height and the second has five, so one appears roughly two-thirds taller than the other. The measured values differ by about two percent. Both readings are arithmetically possible. Only one describes the size of the quantities being compared.
That example is invented, but the problem is real. A chart is not just a set of data labels; it gives the eye a physical shape to compare. When a bar begins at a value other than zero, the length that the reader sees no longer represents the full quantity. The UK Office for National Statistics' axis guidance draws a practical line here: filled shapes such as bars and area charts should start at zero, while lines and scatter plots can use a narrower vertical range when the points are not drawn as lengths from the baseline. The rule comes from what the marks ask the eye to do.
Find the baseline before reading the height
The quickest way to read an unfamiliar chart is to find the zero and the unit before trusting the silhouette. Is the vertical scale counting people, showing a percentage, or recording a temperature? Does it begin at zero, at 90, or at a value near the first mark? Are the intervals between tick labels equal? The answer determines what a visible difference means. With bars, the distance from baseline to top is the main visual measure; a cropped baseline changes that distance.
In five experimental studies, Yang and colleagues tested truncated bar graphs against versions that started at zero. Viewers generally judged the quantity difference as larger with the truncated axis. Across their studies, 83.5 percent of participants showed that effect. Explaining the trick reduced it but did not remove it. That figure describes participants in the researchers' controlled tasks; it is not a claim that exactly that share of people will be misled by every chart. Its force is simpler: reading the axis label may not fully undo the first impression of a tall bar.
The UK Government Analysis Function's chart checklist likewise advises against breaking the numerical axis on a bar chart, even with a visible break mark, because the bar lengths still exert a strong pull. The checklist is aimed at people publishing accessible charts. It also asks for legible labels, source information, and a text alternative. Those details matter together. A reader who cannot see the image needs the numbers and the message in words; a sighted reader needs labels clear enough to check what the image seems to say.
A line is asking a different question
The zero rule does not transfer without thought to every line chart. Imagine a measured value moving from 98 to 100 over a year. If the question is whether it changed, a line plotted from zero may look flat. A range from 90 to 105 could make the movement visible. The line's points still sit at 98 and 100 on a labelled scale; they do not become bars whose visible lengths are offered as the quantities themselves. The ONS guidance gives this very kind of distinction: it permits a cropped axis for a line or scatter chart when that helps show a trend, while asking for space below the lowest point and context around the data.
Permitting a narrower view is not a licence to make a small change sound momentous. Correll, Bertini and Franconeri tested axis truncation across several chart designs. Their crowd-sourced experiments found that truncation affected people's subjective sense of effect size, even with visual cues that warned of the cut. The work also argues that a narrower scale may help or harm according to the question the chart is meant to answer. A line can expose a real small movement while exaggerating how consequential it feels. The axis should tell the reader which task the picture is serving.
Context can change the outcome of a graph-reading experiment as well. In a 2022 randomized study of truncated line charts, Driessen and colleagues presented charts in two different story settings. In their tests, the context influenced participants' opinions about the trend more clearly than the axis treatment did. They did not find a significant effect of the misleading chart on that opinion measure. This does not overturn Yang's result for bars: the chart form, question, and outcome measured were different. It warns against claiming that one visual device controls every reader's judgment regardless of the story around it.
Ask what comparison the chart invites
Sometimes a reader wants the exact difference between two values; sometimes the percentage or ratio matters. Those are distinct questions. In a 2024 series of grouped-bar experiments, Sheng Long and Matthew Kay examined how different truncations affected tasks such as estimating an absolute difference and comparing relative growth. In their tested designs, truncation did not impair performance on certain absolute-difference tasks, while a kind of truncation that disturbed the ordering of relative changes harmed percentage-growth judgments. The experiments refine the blanket warning: the visual choice interacts with the reader's task. They do not make a cropped bar automatically fair in a public chart, where readers may ask several questions at once.
Return to the invented 98 and 100. The absolute difference is two units. The latter is roughly two percent larger than the former. If the baseline sits at 95, the visible bar lengths are three and five units. A reader comparing the bars gets a very different ratio from a reader comparing the labelled values. A line or a dot plot could show the two points on a tight scale if the two-unit difference is the subject. A pair of zero-based bars would serve better if the intended question is how large the whole quantities are relative to one another. Either design should print enough information for a reader to recover the numbers.
The same caution applies across a page of small charts. The ONS guidance recommends consistent scales when panels show comparable data. If one panel spans 0 to 100 and the next 90 to 100, identical-looking slopes or bar heights do not mean identical changes. Reading the tick marks in each panel is more work, but it prevents a layout from quietly making the panels look commensurate when their scales are not.
There is a useful order for the eye. First read the title and unit, then the baseline and interval, then the numbers, and only then the visual drama. Ask whether the chart is making a claim about total size, a difference, a trend or a rate of change. A cropped axis may be a careful way to see a small trend; it may also turn a small gap between full quantities into a cliff. The shape does not answer which one it is. The scale and the question do.
A thought worth keeping?