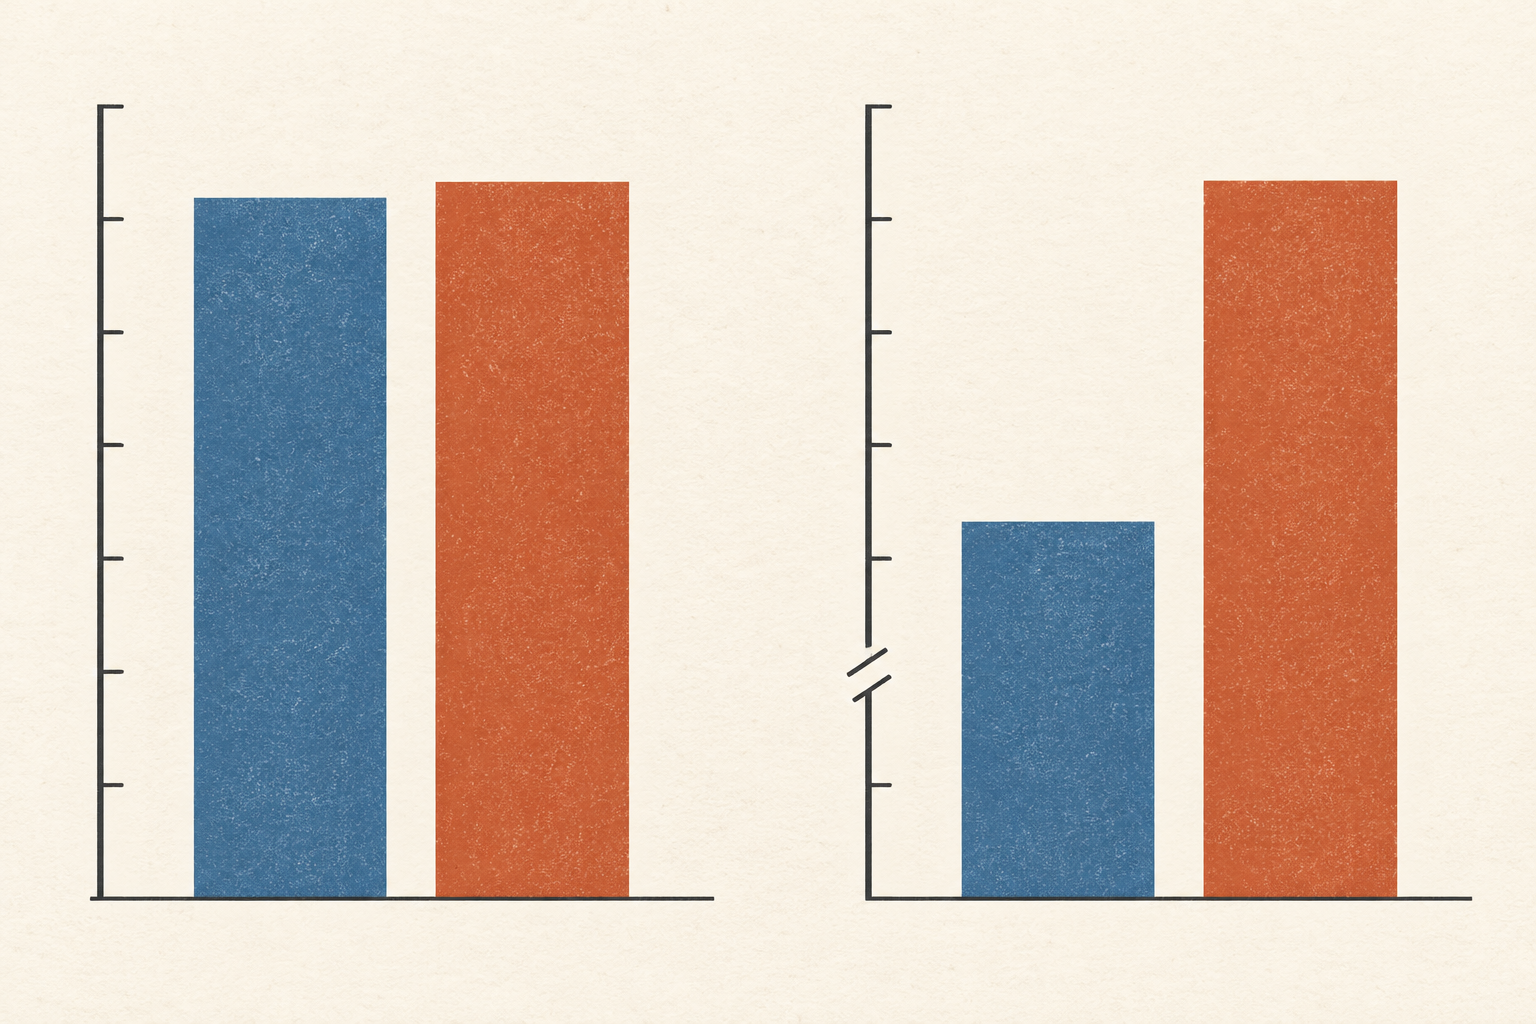
Two hundred people receive a short survey about a local bus service. One hundred and twenty reply; ninety of them say the bus has been reliable. The tidy figure on the report is 75 percent. But it describes the replies. Eighty invited people have left the question unanswered, and the survey cannot see their journeys.
This is an invented example, chosen to expose the arithmetic. Among the 200 invited people, the proportion who would have answered “reliable” could be as low as 45 percent if none of the eighty nonrespondents agreed, or as high as 85 percent if all of them did. Neither extreme is a sensible estimate without more evidence. Their distance shows what the returned forms alone do not establish. A narrow statistical margin around 75 percent could describe chance variation among the 120 replies while leaving the missing eighty unaccounted for.
The problem is not that every person who fails to reply has a grievance. They may have moved, been too busy, found the form inaccessible, or had no reason to care. What matters is whether their chance of replying is connected to the answer the survey is trying to estimate. A bus rider with long waits might be eager to complain, or might have given up on the service and ignored its mail. The direction cannot be guessed from silence.
A percentage with two missing pieces
Survey researchers call this unit nonresponse: an eligible sampled person supplies too little information to count as an interview. The US Census Bureau's American Community Survey guidance distinguishes it from an item left blank on an otherwise usable form. For the whole-person problem, the response rate tells us how much of the intended sample was observed. Bias also depends on how the answers of the observed and unobserved groups differ.
Robert Groves put this relationship at the centre of his 2006 synthesis of nonresponse research. A low response rate can coincide with little bias for one question, and a higher rate can still conceal a meaningful difference for another. The response rate belongs to the survey as a whole; nonresponse bias belongs to a particular estimate. If nonrespondents would answer much like respondents on bus reliability, the missing forms have a smaller effect on that estimate. If their experience differs systematically, the effect grows.
The American Association for Public Opinion Research's standard definitions therefore treat the response rate as a vital accounting measure, while warning that it alone cannot determine how much nonresponse error exists. One must know who was eligible, who was contacted, which contacts became usable interviews, and what can be learned about those who were not interviewed. Calling a survey “large” because it mailed many invitations says little if the analysis quietly uses only the people who wrote back.
The difference depends on the question
Pew Research Center tested that point with two US telephone surveys in 2012. Its standard five-day survey interviewed 1,507 adults and had a 9 percent response rate; a longer, more intensive effort interviewed 2,226 and reached 22 percent. Pew compared results with each other and with external benchmarks. Many weighted political, social and economic estimates were close to those benchmarks despite the low response rate. Measures of civic activity were more troublesome: people who volunteer and take part in community life were more likely to take part in surveys too. The very behavior being measured could affect who appeared in the measuring instrument.
Pew's 2017 follow-up found a similar split. Its telephone polls tracked several political and demographic benchmarks reasonably well but overstated some kinds of civic engagement. That does not certify every low-response poll or make a higher rate unnecessary. It shows why the correct question is about this measure in this survey. The same set of respondents can support a good estimate of one characteristic and a biased estimate of another.
Even the comparison with a benchmark needs care. A government survey or administrative record may use different words, cover a different period, or have its own errors. The strongest comparison matches the population and definition as closely as possible and admits what it cannot test. In the bus example, a route's recorded on-time arrivals might help check a claim about timetable performance, but it would not directly reveal whether a passenger found the trip reliable after a missed connection.
What can be done with the silence
The first repair is to bring in more of the selected people, especially kinds of people who seldom answer. A reminder, a different contact mode, a shorter form, or a follow-up visit may change who responds. It can also change the cost, the wording people encounter, or the way they answer. The gain has to be judged against those effects, rather than treated as a free increase in quality.
Researchers also use information known for respondents and nonrespondents. If the sample frame records age, location, or another relevant characteristic, they can compare the groups and give more weight to underrepresented respondents. The Census Bureau says the American Community Survey makes noninterview adjustments that raise the weights of interviewed units. The National Health and Nutrition Examination Survey's documentation describes a similar sequence: initial weights for selection probabilities, then nonresponse adjustments, then alignment with population totals.
Such weighting can correct a difference it can see. It cannot guarantee that respondents and nonrespondents within the same weighting group would have answered the bus question alike. The National Center for Health Statistics' investigation of its 2017–18 survey illustrates both sides of the trade. Additional calibration to education and income, along with other characteristics, sharply reduced its measured nonresponse bias. For some estimates it also increased variance. The agency used external comparisons, comparisons within the sample, and alternative adjustments to assess the problem before releasing the data. These findings are about that survey and its measured outcomes, not a promise that any set of weights repairs any missing group.
There are limits to what can be recovered. If the people with the longest bus waits are less likely to reply even among riders of the same age and neighborhood, age and neighborhood weights will not reveal their missing experiences. Researchers can make assumptions and test how conclusions change under plausible alternatives; they should say which part of the answer rests on those assumptions. The missing people do not become measured because a spreadsheet assigned their neighbours larger numbers.
The useful report of a survey thus gives more than a percentage of returned forms. It names the population it intended to reach, explains how people were selected and contacted, states how many eligible people replied, and shows what checks or adjustments were made for those who did not. Then 75 percent can be read for what it actually is: a clear description of the answers received, with a carefully argued path—if one exists—from those answers to the people the survey was meant to represent.
A thought worth keeping?