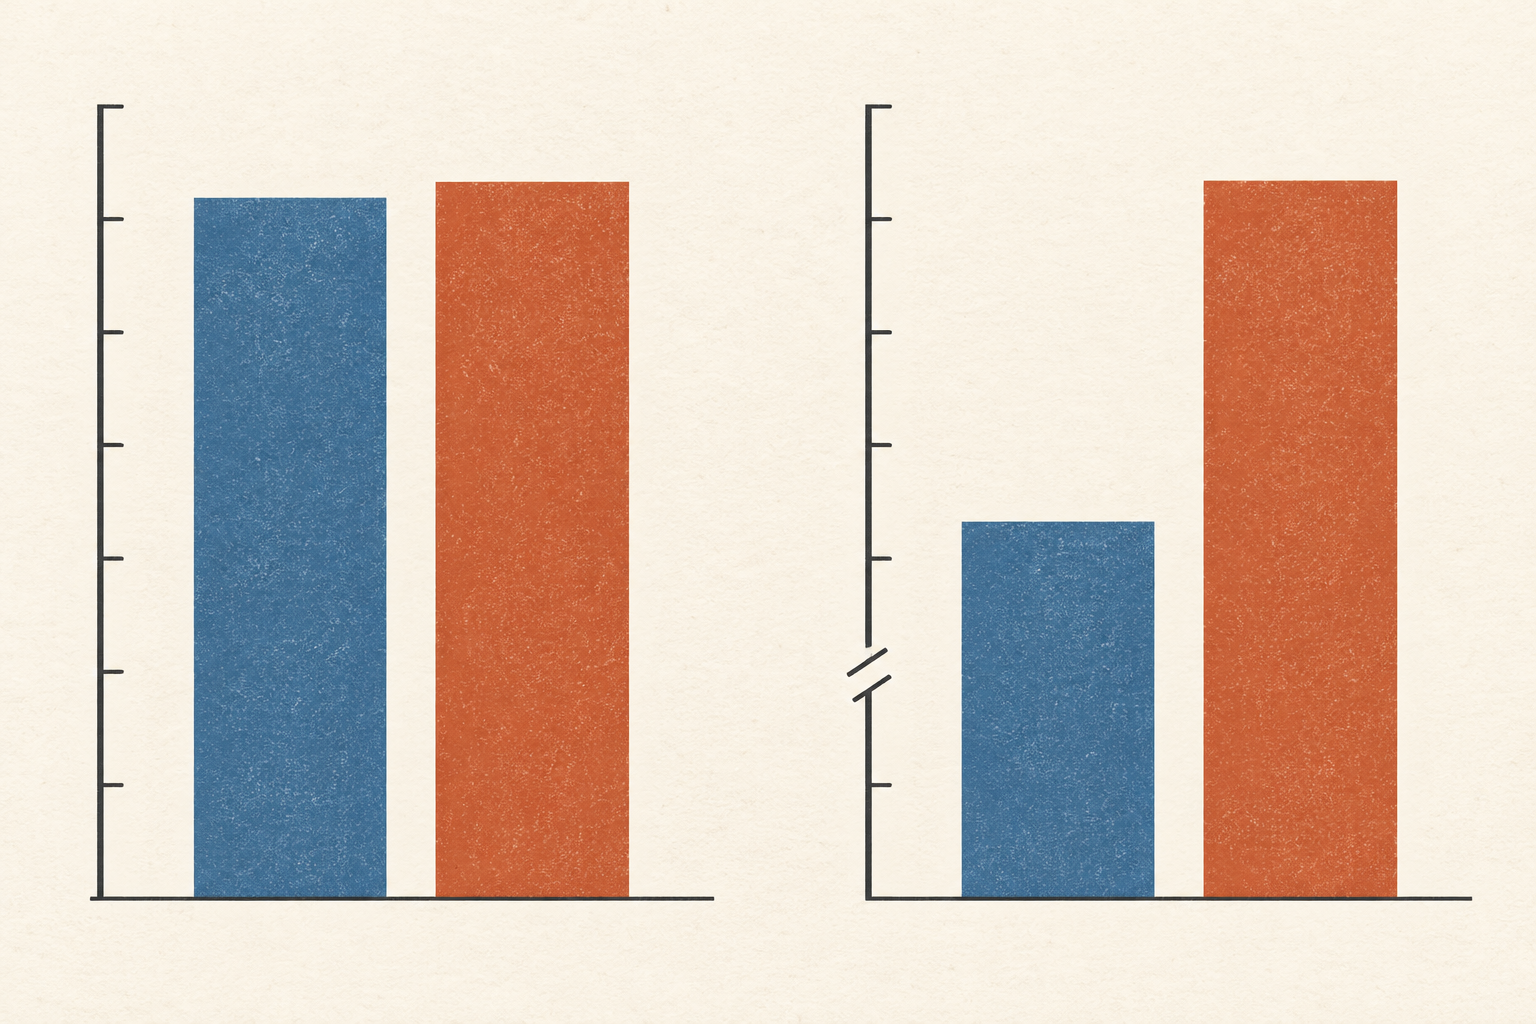
In Chicago's public schools, reading and mathematics scores rose sharply after a new accountability policy took effect in 1996–97. That sounds like a clear verdict until another exam enters the picture. Brian Jacob's study found that the gains on the consequential tests did not produce comparable gains on a state exam with lower stakes. The score rise was measurable; what it meant for learning beyond that test was less certain. The original study makes a useful starting point for any question about a benchmark that has become a target.
A benchmark is a deliberately small view of a larger thing. A school test samples knowledge; an image-classification dataset samples images; a service dashboard samples encounters with customers. When people use the score to choose, reward or punish, they begin to change their work in response to the sampled view. Some of those changes improve the larger thing. Others improve the score more than they improve what the score was supposed to represent. An upward line cannot sort the two on its own.
Donald Campbell described the danger in a 1976 paper about evaluating social programs. The more a numerical indicator matters to decisions, he argued, the more pressure it faces and the more it may alter the process it observes. He also said the evidence he offered then was predominantly anecdotal. His warning is a question to investigate, rather than a rule that proves every improvement false.
The part of the world the test can see
Think of a vocabulary exam with forty selected words. Learning those forty words would raise the mark. It would also teach forty actual words. But if the score is used to claim that a person's whole vocabulary has grown at the same rate, the inference has outrun the evidence. Daniel Koretz uses this explicitly hypothetical case in his 2005 report on score inflation. Tests must sample large domains; their value rests on how well performance on the sample speaks for the domain. Preparing for the particular sample can break that link.
That distinction is kinder and more exact than treating every form of preparation as fraud. Better instruction may help pupils answer both familiar and unfamiliar questions. Practice may also make a test less frightening, allowing pupils to show knowledge they already have. Rehearsing only the likely item types may produce a narrower gain. Teaching the answer to an actual test item is narrower still. These actions differ in ethics and educational value, though each may move the same score. Koretz defines inflation as a gain that substantially overstates the improvement in learning it appears to imply; he does not say that the gain contains no learning at all.
The design of the published number matters as much as the questions. The National Research Council's 2011 review points out that an average score responds to changes across the range, while a measure of the percentage crossing a pass line is especially sensitive to pupils near that line. If a school is judged by the pass rate, an extra hour spent with a pupil just below the threshold may change the reported result; an extra hour spent with one far below it may not. Both pupils could benefit from the attention. The indicator assigns different credit to those benefits. Such arithmetic shapes priorities even when nobody falsifies a record.
What the Chicago case shows
Jacob compared Chicago's results after the accountability policy with earlier district trends and changes in other large Midwestern urban districts. His analysis attributed much of the score increase to test-specific skills and student effort. It also found no comparable increase on the lower-stakes state exam. Teachers' responses included more special education placements, retaining some students before the tested grade, and moving attention away from science and social studies. Those are findings about one policy, place and period, not a license to assume that every school acted alike or that every placement was improper.
The lower-stakes exam is important because it asks a related question outside the most direct pressure of the target. It does not give a perfect measure of everything children learned; the two tests can differ in content and difficulty. But if the consequential score leaps while a less targeted measure moves much less, the gap calls for explanation. The National Research Council's review recommends evaluating test-based incentives with measures that are not themselves attached to those incentives. The independent measure is a check on the claim being made from the rewarded one.
There is also a more basic issue of who is counted. A reported pass rate depends on the numerator, the denominator and the rule deciding which pupils sit the test. A change in grade retention or test eligibility can alter the population behind the percentage, apart from any change in what a given pupil knows. That does not establish that a particular Chicago score increase came from a changed denominator. It explains why an editor reading any accountability claim should ask for participation and classification rules alongside the headline result. A comparison across years needs a comparable group, not merely the same column heading.
A benchmark used by machines and researchers
In machine learning, a similar vulnerability can arise through a different route. Researchers train many models and compare them on a standard test set. If they repeatedly inspect the same public result and use it to choose the next architecture, features or settings, their decisions become adapted to that set, even when no test image is directly used for training. Cynthia Dwork and colleagues' 2015 work on adaptive data analysis explains why methods built for a fixed analysis can lose their usual guarantees when later choices depend on earlier results from the same holdout data. This is a statistical problem of repeated feedback, distinct from the institutional incentives in a school.
It would be tempting to treat a fresh test set as a simple verdict. A 2019 study by Benjamin Recht and colleagues constructed new test sets for two much-used image benchmarks, following the original collection processes closely. The researchers reported lower accuracy on the new sets: 3 to 15 percentage points for CIFAR-10 and 11 to 14 for ImageNet. Yet models that improved on the old test sets tended to improve by even more on the new ones. The authors argued that the new images were slightly harder, rather than finding that repeated adaptation caused the drops. A lower score on new data can expose a limit in generalization without proving that the old progress was hollow.
That result matters because a useful audit has to examine the new measurement too. Did the image mix change? Are the labels and difficulty comparable? Was the held-out data truly untouched by model selection? A benchmark can mislead through adaptation to the old test, or through an unrecognized shift in the new one. Comparing results only works when the comparison itself has been built and described with care.
Reading an improved score
Before celebrating or dismissing a rising benchmark, ask what behavior its design rewards. Which part of the desired outcome does the test sample? What falls outside it? Who can affect the score, and by changing what? Are the same people, cases or images included across reporting periods? What happens on a related measure that carries less direct reward? These questions make the number more informative, not less.
The answer is seldom to add several numbers and declare the problem solved. Each measure can create its own incentive and blind spot. The National Research Council recommends broader coverage and multiple measures, while recognizing the practical limits of any test. In a school, that might mean looking at learning in subjects outside the tested pair and examining how the tested population changes. In a model evaluation, it might mean a genuinely held-out assessment and an account of how its data were collected. The choice depends on the claim at issue; there is no single independent test that can certify every kind of progress.
A benchmark earns its place by making comparison possible. Once it becomes a target, the comparison needs a second question beside it: what changed to produce this score? The Chicago result is more revealing with the lower-stakes exam and the changes in school practice in view. The image-classification result is more revealing with the difficulty of the new images in view. The number still tells us something. The work is to find out exactly what it tells us now.
A thought worth keeping?