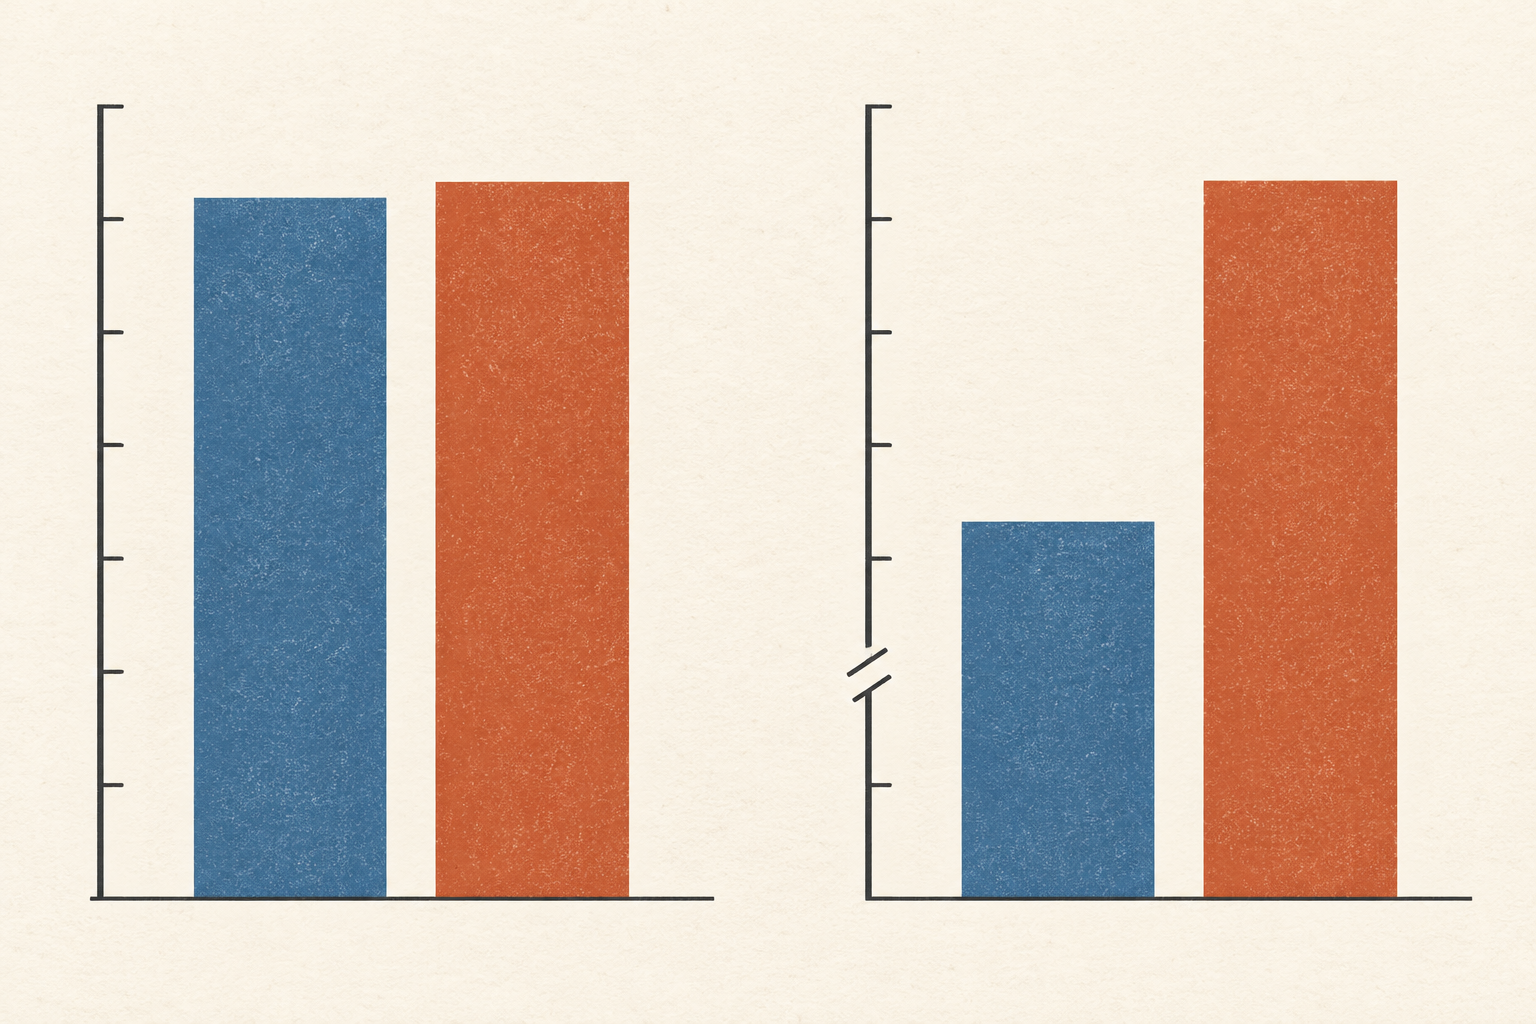
Reading a chart with an uneven baseline
A cropped axis can turn a small gap between values into a towering gap between bars. The right way to read it depends on the mark, the scale, and the comparison being asked of the reader.
A place for slower thoughts
How measurements, samples and comparisons support a claim.
Words by Clara Moss
A cropped axis can turn a small gap between values into a towering gap between bars. The right way to read it depends on the mark, the scale, and the comparison being asked of the reader.
A rising benchmark can signal real progress, narrower preparation, or a changed comparison. Evidence from school testing and image classification shows how to tell those stories apart.
A response rate counts missing voices, but bias depends on what those voices would have said. Real survey comparisons show why the same respondents can support one estimate better than another.
The familiar 95% label belongs to a sampling and calculation method. A small clean sample shows how one formula can erase uncertainty, while another keeps the limit visible.
A percentage can be accurate and still leave its central question unanswered. Trial results, road fatalities and graduate admissions show how the population, exposure and time beneath a number change what it means.