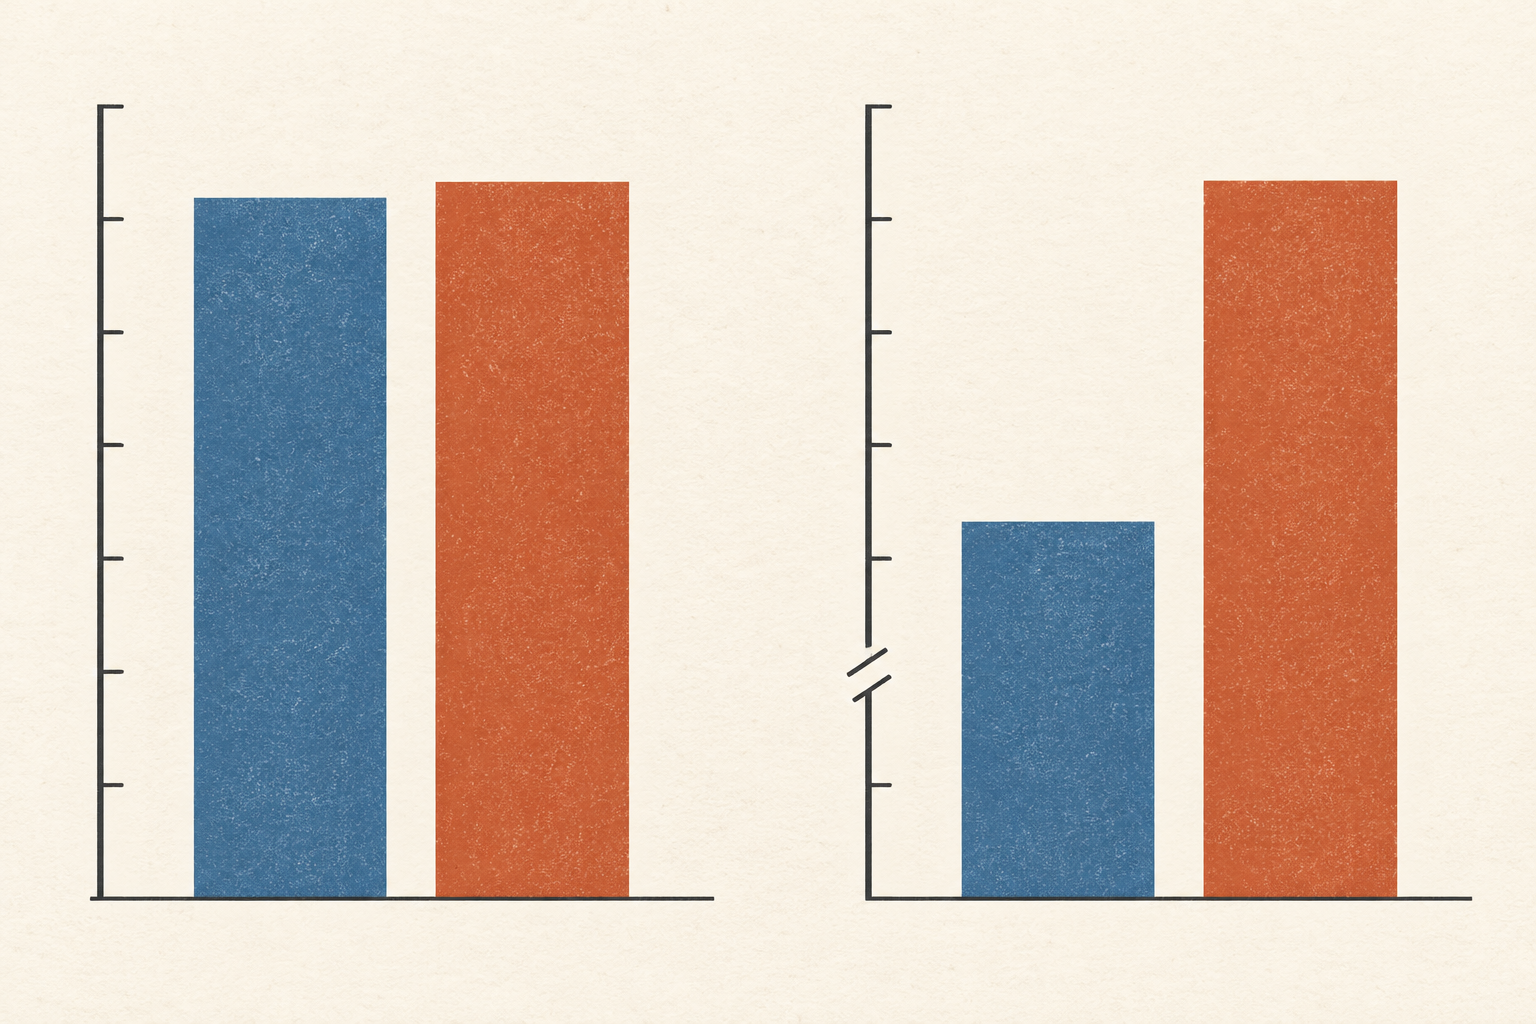
In December 2020, a vaccine trial reported a striking result: 95% efficacy against a defined form of COVID-19. The number was meaningful. It also left a reader with several fair questions. Ninety-five percent of what? Among whom? For how long? The answers sit below the headline, in the people counted, the event being counted and the time over which they were watched.
The Pfizer–BioNTech briefing submitted for the FDA's December 2020 advisory meeting reported eight confirmed cases in the vaccine group and 162 in the placebo group for its first primary endpoint. That endpoint counted a first confirmed symptomatic case beginning seven days after the second dose, among participants without evidence of infection before or during the vaccination course. The table listed 18,198 participants in the vaccine group and 18,325 in the placebo group. Its formal efficacy estimate adjusted for surveillance time; it was not simply a subtraction of the two case counts.
Dividing the cases by those group sizes gives a rough, useful view of the trial: about 0.044% of the vaccine group and 0.884% of the placebo group had a counted case. The difference is about 0.84 percentage points. The relative reduction is about 95%. Both descriptions come from the same trial, but they answer different questions. The relative figure compares the groups' rates; the absolute difference describes how far apart the observed proportions were in that study. Neither predicts an individual's risk in another place or year, with a different virus or a different period of follow-up. The 2020 result belongs to its endpoint and its moment.
Exposure changes the road statistic
A denominator can be a population, or it can be the amount of opportunity an event had to occur. Consider U.S. road deaths in 2020. The National Highway Traffic Safety Administration's Quick Facts 2020 records 38,824 fatalities, up from 36,355 in 2019. That count tells us more people died. It does not, by itself, tell us how the danger changed for a given amount of travel.
The same report gives two rates. Fatalities per 100,000 residents rose from 11.07 to 11.78. Fatalities per 100 million vehicle miles traveled rose more sharply, from 1.11 to 1.34. The Federal Highway Administration's vehicle-mile table records why the two rate changes differ: total U.S. vehicle travel fell from about 3.262 trillion miles in 2019 to about 2.904 trillion in 2020. There were more deaths despite substantially less measured travel.
Neither rate is a trick. Deaths per resident describe a burden on the population. Deaths per mile relate deaths to one measure of road exposure. A person making a trip may want a different measure again, because miles do not all have the same conditions or users. The national figures cannot isolate what caused the change, and they do not describe every driver's risk. Yet placing the two denominators beside the count prevents a reader from mistaking a higher death toll for the whole story.
The group beneath the group
Sometimes the most important denominator is a smaller group hidden inside the reported total. A 1975 study by Peter Bickel, Eugene Hammel and J. W. O'Connell examined 12,763 sufficiently complete applications for fall 1973 graduate admission at the University of California, Berkeley. About 44% of the 8,442 male applicants were admitted, compared with about 35% of the 4,321 female applicants. Taken across the campus, the difference looked like strong evidence that women faced less favourable admissions decisions.
But the applications went to 101 departments and graduate majors, which largely made their own decisions. Women and men applied to those programs in different proportions. Women more often applied to programs that admitted a smaller share of all applicants. When the researchers compared admissions within departments and then pooled those comparisons, the campus-wide pattern changed. Their department-adjusted analysis found a small statistical pattern favouring women in 1973, under their stated assumptions.
The adjustment did not erase the institutional question. The researchers explicitly distinguished a pattern in admissions decisions from the earlier educational and social processes that influenced which fields applicants entered. They also identified individual departments with departures in both directions and acknowledged the difficulty of knowing applicants' relevant qualifications. The lesson is not that one percentage was false and the other true. The aggregate rate accurately describes who was admitted from the people who applied. The within-department comparison examines a different question: how applicants of different sexes fared where admission decisions were made. A number can be correct while being poorly matched to the claim attached to it.
Time can be hidden in a denominator too. The CDC's epidemiology lesson on measures of risk distinguishes an incidence proportion—new cases divided by the initially at-risk population over a specified interval—from an incidence rate, which divides new cases by the sum of the time people were observed at risk. Ten people followed for a year and ten followed for a month do not provide the same amount of observation. Person-time gives that difference a place in the calculation. It still needs a clear starting point, endpoint and account of who was actually observed. A rate without its period can make a brief episode look like a lasting condition.
Presenting the underlying counts helps the reader see these choices. In experiments published by Gerd Gigerenzer and Ulrich Hoffrage, statistically inexperienced participants solved conditional-probability problems more often with information expressed as natural frequencies than with standard probability formats. In one comparison, the researchers classified 16% of responses in the standard probability format as using a Bayesian method, versus 46% in a corresponding frequency format. That experiment does not mean every percentage should be replaced by a pile of counts. It shows that format can make the path from a reference group to a conclusion easier to follow.
A useful statistic therefore carries more than its numerator. It says which people or events were eligible to be counted, what exposure or time they contributed, and what comparison the number is meant to support. If those facts are absent, the first question is not whether the striking figure is wrong. It is whether the figure answers the question the sentence asks it to answer.
A thought worth keeping?